|
| |
|
|
|
|
|
|
|
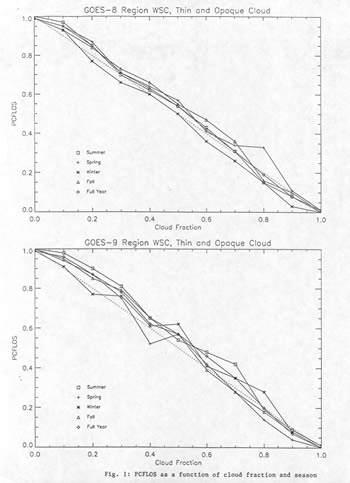
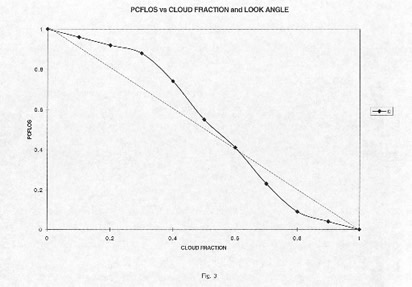
Cloud Free Line of Site StatisticsData acquired with the Day-only WSI in the mid-to-late 80’s were processed to yield a library of cloud decision images taken at 1/3 degree resolution once a minute over a 1 year period at each of four sites. This resulted in approximately 25,000 images at each site. A few years back, the data were processed to yield a study of cloud free line of sight statistics. A few examples of the results are shown below. The plots shows the probability of cloud free line of sight (PCFLOS) as a function of season, for a site near White Sands, New Mexico. These PCFLOS values are for the directions to the GOES 8 and 9 satellites. There is of course a very strong correlation with cloud fraction. An interesting feature of this data can be seen by plotting the data nearer the zenith or horizon. The shape of the curve is different for overhead vs near-horizon cases. The plot below shows all seasons for a look angle at the zenith. Note that when the cloud fraction is near 0.8, the PCFLOS is less than 0.2, whereas models we are familiar with predict a probability greater than 0.2 due to the vertical cloud structure. We believe these results may be valid, however, because cases with cloud high fraction may often consist of a solid cloud sheet that covers most of the sky. If the clouds are in the form of a single sheet, as opposed to a random distribution, then when the cloud fraction is large the zenith would be obscured. For this reason, we believe that the dip near .8 cloud fraction, and the corresponding rise in the curves for look angles near the horizon and near .8 cloud fraction, are probably real.
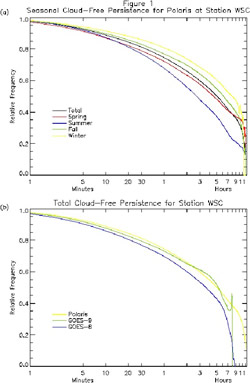
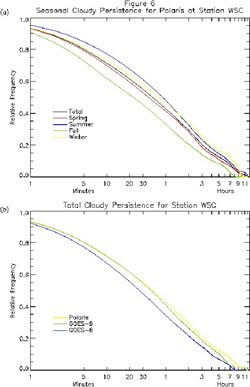
The figures above show examples of persistence statistics that were extracted as part of this study. For the desert site near White Sands, the time required for the yearly persistence probability to drop below 0.5 was 305 minutes for the cloud free case. This statistic is for the direction of Polaris. That is, if it was cloud-free, there was a 50% probability that it would remain cloud-free after 305 minutes. The 50% probability case for cloudy is only 41 minutes. That is, if it was cloudy in the Polaris direction, there was a 50% probability that it would remain cloudy after 41 minutes. A similar pattern was found for Albuquerque, the other desert site, ie relatively long cloud-free persistence and short cloudy persistence. Columbia had quite long persistence for both cloud free and cloudy (186 and 156 minutes, respectively). Malabar Florida, where we often observed small clouds moving quickly, had quite short persistence for both cloud free and cloudy (47 and 22 minutes respectively). Thus both conditions (cloud-free and cloudy) tended to be relatively stable at Columbia, and relatively short-lived at Malabar. In addition to including PCFLOS results for all the stations, seasons, several look angles, etc, the study included a variety of persistence studies, as well as multi-station persistence results. These multi-station persistence studies are designed to show how long one can expect any single station to remain clear if there are 3 stations available, and similar statistics.
Produced
by the Marine Physical Laboratory, SIO.
|